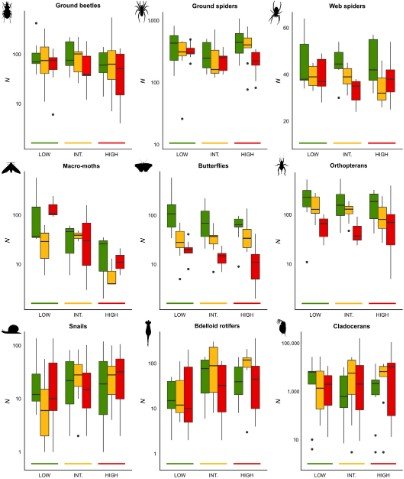
Graphical presentation of data (median, quartile and interquartile range)
Abundances (N) of the nine examined groups in response to local‐ (subplot) and landscape‐scale (plot) urbanization levels. Labels at the X‐axis represent the degree of urbanization at the landscape scale. Y‐axis scale varies among groups and is log10‐transformed, except for web spiders. Colours of the boxplots refer to urbanization levels at the local scale (green [medium grey in printed version] = low; yellow [light grey in printed version] = intermediate; red [dark grey in printed version] = high). Boxplots display the median, 25% and 75% quartiles and 1.5 interquartile range. The nine animal silhouettes are from PhyloPic
source: Piano, E., Souffreau, C., Merckx, T., Baardsen, L. F., Backeljau, T., Bonte, D., … & Decaestecker, E. (2020). Urbanization drives cross‐taxon declines in abundance and diversity at multiple spatial scales. Global Change Biology, 26(3), 1196-1211.