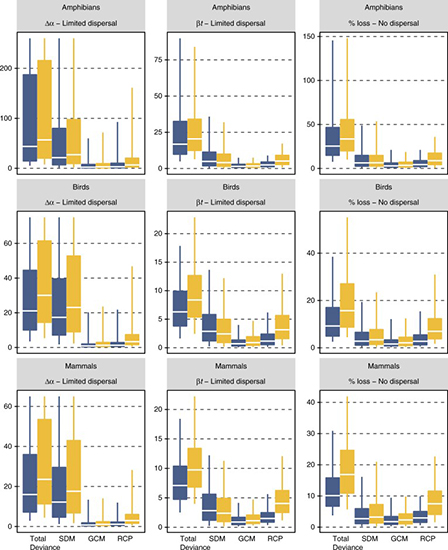
Absolute influence of the different sources of variation on pixel-based sensitivity metrics. The plot represents the absolute influence of the choice of species distribution models (SDMs), global circulation models (GCMs) and representative concentration pathways (RCPs) on the change in α-diversity per-pixel (Δα), temporal species turnover (βt) and percentage of species loss per pixel (% loss). The deviance was calculated across all pixels together by means of a nested ANOVA and the partitioning is represented by the absolute deviance to show the difference in deviance between metrics. Dark and light grey correspond to the horizon 2041–2060 and 2061–2080, respectively. Total deviance bar shows the total deviance that was explained by all components in the ANOVA. The central line of each box correspond to the median, the bounds of box represent the 25 and 75% quantiles, and the whiskers represent the quantiles 0.05 and 95%
source: Thuiller, W., Guéguen, M., Renaud, J., Karger, D. N., & Zimmermann, N. E. (2019). Uncertainty in ensembles of global biodiversity scenarios. Nature Communications, 10(1), 1-9.