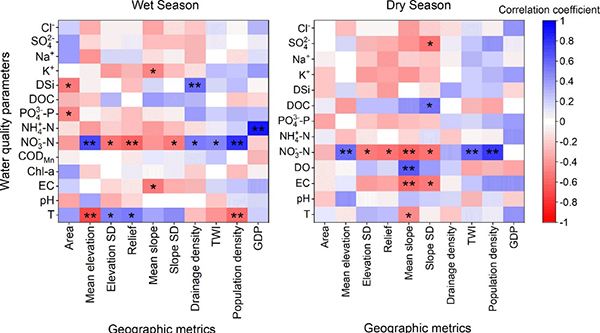
Correlation coefficient for Pearson correlation analysis between the geographic metrics and water physic-chemical parameters during the wet (left) and dry (right) seasons. Red and blue correspond to the negative and positive correlation, respectively. Light color represents lower correlations while darker color represents higher correlations. * p<0.05; ** p<0.01. (For interpretation of the references to colour in this figure legend, the reader is referred to the web version of this article.)
source: Xu, S., Li, S. L., Zhong, J., & Li, C. (2020). Spatial scale effects of the variable relationships between landscape pattern and water quality: Example from an agricultural karst river basin, Southwestern China. Agriculture, Ecosystems & Environment, 300, 106999.